

And a Reminder that Statistics Don’t Lie. People Lie…Sometimes Using Statistics
So I’ve been told that writing a blog on statistics is like keeping a journal on the progress of one’s house painting. Nobody is going to click.
That may be true, but I just can’t resist. So I’ll keep it short.
If Coronavirus has done one thing, it has brought statistical discourse into the mainstream whether we know it or not. Problem is that most people have virtually no understanding of statistics. To be sure, I’m no statistician or even statistics hobbyist. I understand statistics to the point that I am able to do my work as a sociologist. So there are probably those who can do a much better job of describing this stuff. But I’ve not seen them do it, so here I am.
We are now living in a world where we are constantly talking about flattening curves, peaking, and probabilities. All of these are statistical terms and all of them can be helpful in understanding our current reality and plan for our futures. We are all getting a crash course in statistics. There is, however, one common sense notion being bandied about that I think requires some more statistical depth of field. I think it is being misused, or misapplied, perhaps innocently–perhaps not.
I’m referring to the claim that as we do more testing we will see the reported levels of Coronavirus rise. Therefor, we should not be alarmed when we see this. Often, the way this is being presented in the media is that increased testing will give a false impression of an increase in the growth of the virus, inferring that the “real” number is much more manageable.
Um…that’s not how this works. Let me explain.
When we are testing for the virus we are, in essence, conducting surveys of people’s anatomical responses to an infection. It’s very similar mathematically to any other survey. Every survey has a particular Standard Error, or a range within which one can feel pretty sure that the real number falls. In other words, if I tell you that 50% of a population prefers boxers to briefs (I’m making this up, don’t quote me) and then give you a Standard Error of + or – 5%, that means I’m confident that between 45% and 55% of the population, based on my survey, prefers boxers to briefs.
Why does this happen?
Well, I did a survey and 50% of the people in my survey said they preferred boxers to briefs. I then generalized that survey to the population as a whole, but I’m taking some liberties in doing so. Maybe there are some subtle differences among the group I surveyed that is not true for the population as a whole, so I had to do some fancy schmancy calculations to come up with the Standard Error(1). This calculation tells me that the real number of people who prefer boxers to briefs may not be 50%, but we can feel real confident–like 95% confident–that the real number is between 45% and 55%. Of course, if we are 95% confident that the real number is between 45 and 55, that means there’s a 5% chance that it may not be between 45 and 55…but you know…I was told I shouldn’t do blogs on statistics so…
So what can I do to reduce the error? After all, it’s one thing to have a range for underwear preferences, but potentially deadly viral infections…we want to get that straight.
Well, you can reduce the error by surveying more people relative to the population. The more people you survey, the more valid the number, the smaller your Standard Error. So try this thought experiment. If we could test everyone in the country, 100% of the population, and get a percentage of the number of people infected with Coronavirus, we can feel pretty comfortable that that number is the right number. We can’t be 100% confident because there are false positives and negatives, but still…that’s a pretty strong number.
Now let’s say we can only test half the population. Common sense would tell you that that number would be about half as reliable(2).
Well, under most circumstances we are surveying relatively small samples of the population, but we can get pretty good numbers from a sample size of only a few thousand.
So, what does that mean with regard to virus testing and the claims made about the reported number of cases? That means that as you test more people, the number resulting becomes more valid. In other words, it’s more likely to be the real measure of the number of real cases of the Coronavirus.
That means, saying that the number of reported cases will increase as a result of more testing is not a suggestion that that number is artificially high as is often inferred in such statements. Rather, it’s an acknowledgement that our current number is an underestimate based on limited testing.
Now I should point out that most of what we as laymen are looking at when we try to map out the course of the disease is the raw numbers of people testing positive. Usually, when sociologists look at trends, we look at rates, how many people per, say 10,000 have tested positive. However, rates of Coronavirus infection appear to be really low, about 2.2/1000 total confirmed cases in the United States. Most people don’t perceive small numbers well, so for lay purposes looking at the total numbers rather than the rates may be more descriptive (arguably).
Either way, more testing gives a better number. The higher number is not a distortion of the stats. Our current numbers, in the face of inadequate testing, is the distortion.
- No I didn’t. The statistics program I typed the data into did it form me. I just hit the drop down selection and checked the box.
- Okay, that’s not how the math works out…for
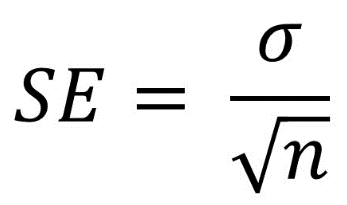 the purists, the formula for standard error is above. In other words, that funny looking symbol is a lower case Sigma. It represents the Standard Deviation. n = the number of people in your sample. So the SE equals the Standard Deviation divided by the square root of the number of people in the sample. So that begs the question, “well, how do you calculate Standard Deviation?” Look, if you want to go that far, look it up.


Leave a comment